Asset Dashboard
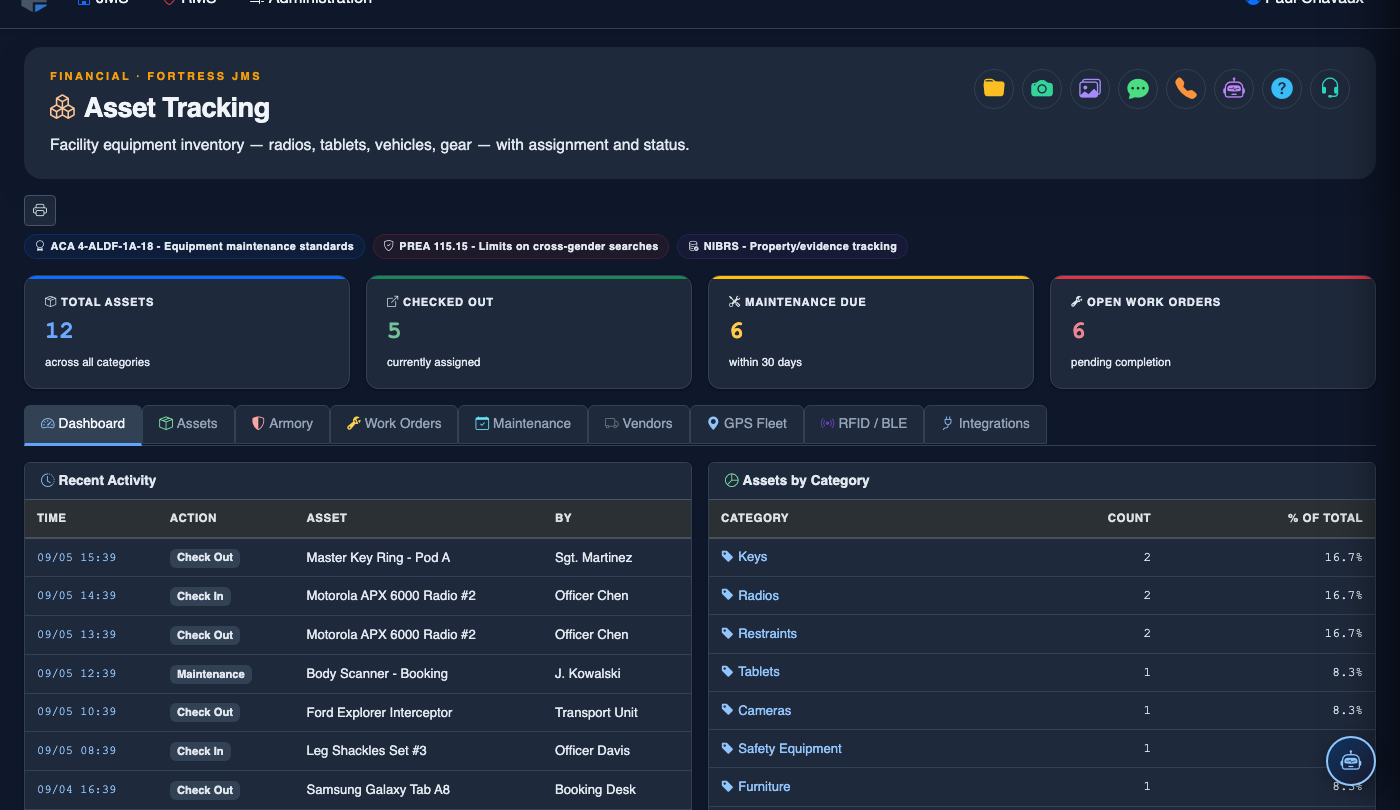
The Asset Dashboard tab is your command center for facility asset health. Real-time KPI cards, category breakdowns, and trend charts give administrators and shift supervisors an instant, accurate picture of the facility’s entire asset portfolio — what is in use, what is in maintenance, what is unaccounted for, and what needs attention right now. No spreadsheets, no manual counts between shifts.
KPI Summary Cards
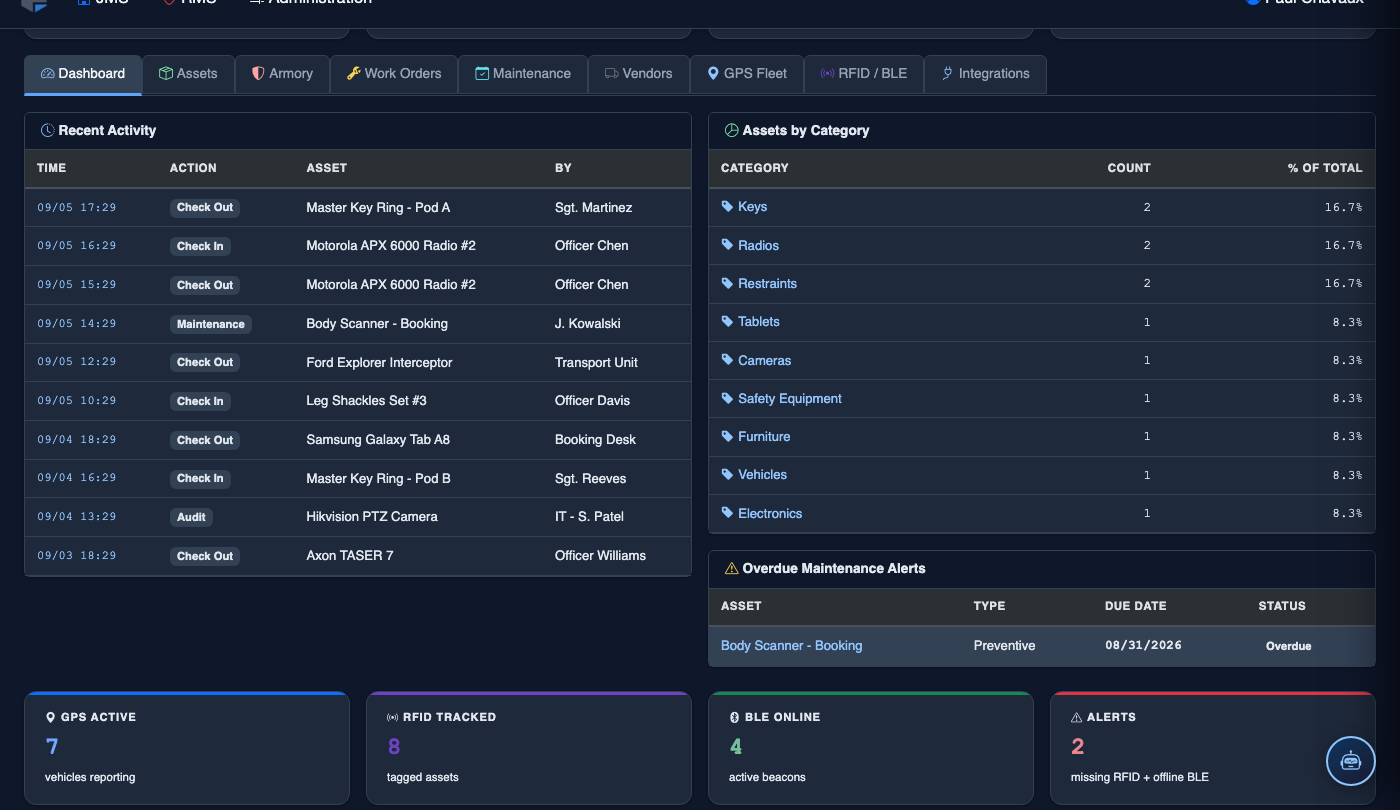
Total assets, assigned, in-maintenance, and unaccounted counts displayed as color-coded cards that update in real time.
Category Breakdown
A visual chart shows asset distribution across facility-defined categories, making it easy to spot which areas hold the most inventory.
Trend Analysis
30-day and 90-day trend lines reveal patterns in asset loss, maintenance frequency, and issuance volume to support budget planning.
Unaccounted Alerts
Unaccounted asset count is highlighted in red with a direct link to the affected records so officers can resolve discrepancies immediately.
Step-by-Step: Using the Asset Dashboard
Open the Asset Dashboard
Navigate to Asset Tracking in the main menu. The Asset Dashboard tab loads by default, displaying the four primary KPI cards at the top of the page with live counts.
Interpret the KPI Cards
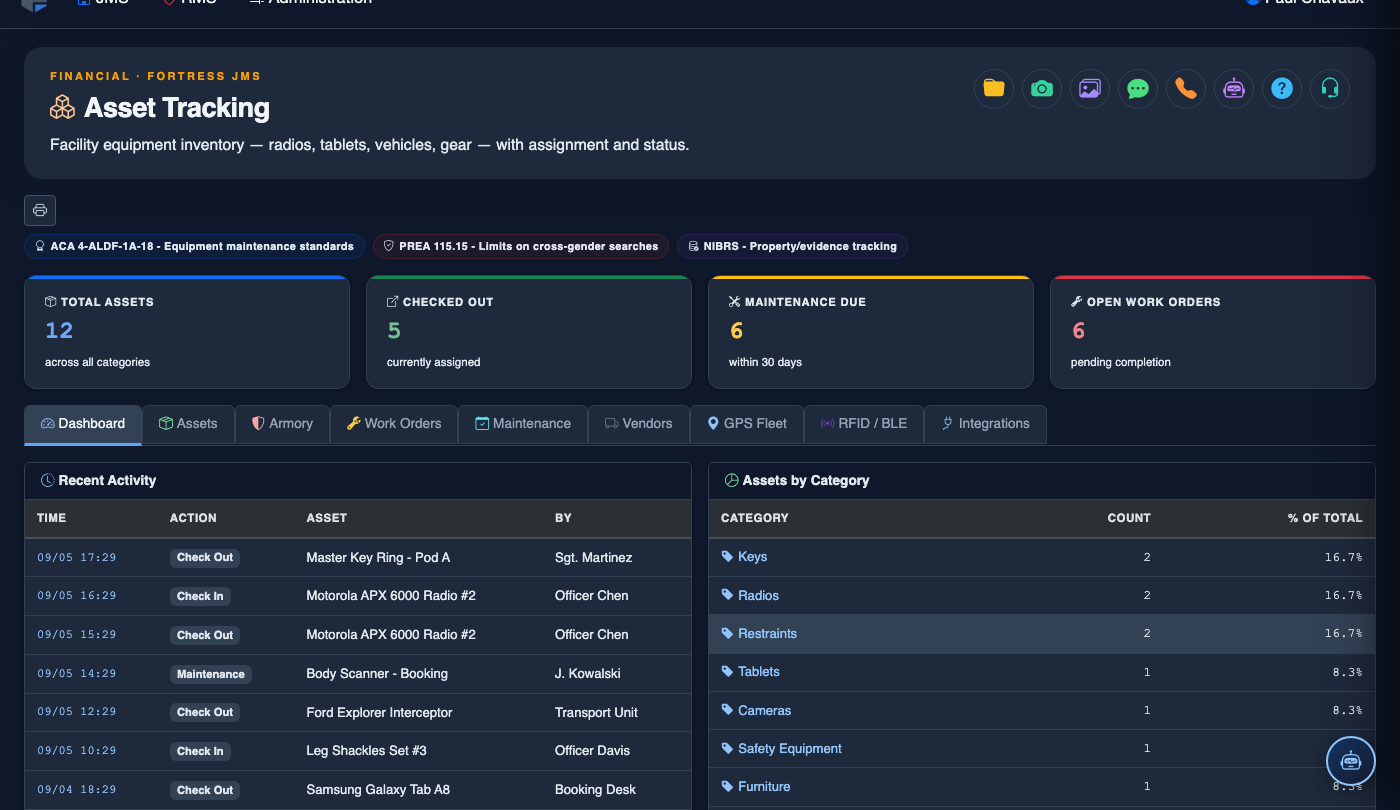
Read the four cards: Total Assets (blue), Assigned (green), In Maintenance (amber), and Unaccounted (red). Any non-zero value in the red Unaccounted card requires immediate officer action.
Drill Down from a KPI Card
Click any KPI card number to navigate directly to the Asset Inventory tab pre-filtered to that status. For example, clicking Unaccounted shows only the assets currently missing from their expected location.
Review Category Breakdown Chart
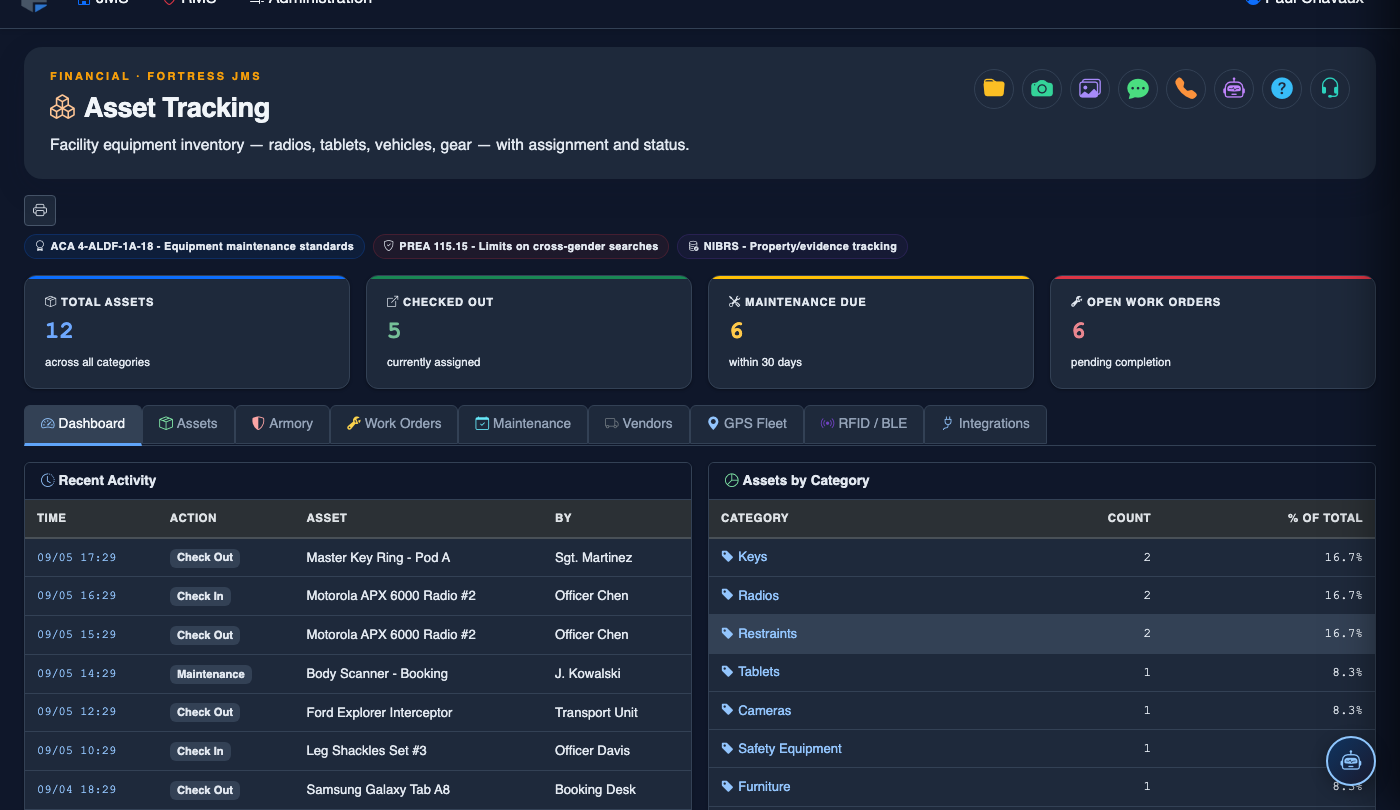
Below the KPI cards, the Category Breakdown chart shows asset counts per category. Click a category slice or bar to filter the inventory view to that category alone — useful before a scheduled inspection of a specific area.
Analyze Trend Data
Toggle the trend chart between 30 Days and 90 Days using the buttons above the chart. Rising maintenance trends may indicate aging equipment nearing end-of-life; rising unaccounted trends may indicate process gaps at shift handoff.
Print or Share the Dashboard Summary
Click Print Dashboard or Export Summary PDF to capture the current state of all KPIs and charts. This is useful for shift briefings, administration reports, or evidence that an inventory reconciliation was completed on a specific date.
💡 Pro Tips
- Bookmark the Asset Dashboard and make it the first page officers open at the start of every shift — a 30-second review of the KPI cards is a complete facility asset health check.
- If the Unaccounted card is consistently non-zero at shift start, review your check-in procedures at the end of the previous shift; the gap is almost always a process issue, not a loss.
- Use the 90-day trend during budget season to document maintenance costs per category and justify equipment replacement requests with objective data.
Mobile View — Asset Dashboard
FortressDMS is fully responsive. Officers can access the Asset Dashboard on a phone or tablet directly from the field — no app install required.
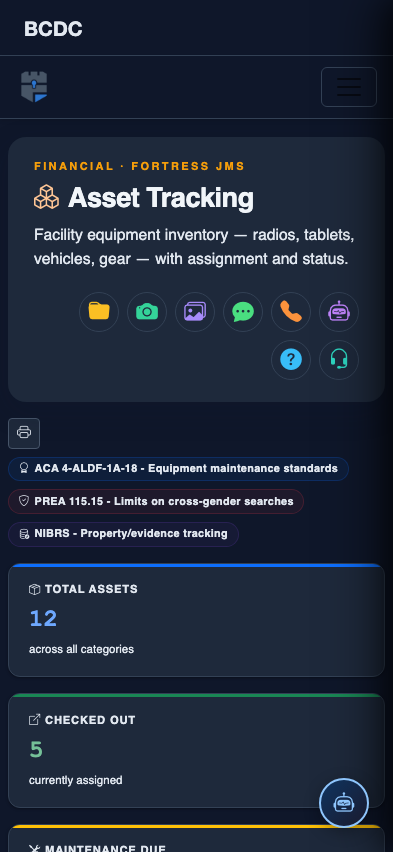
Tab view with data rows
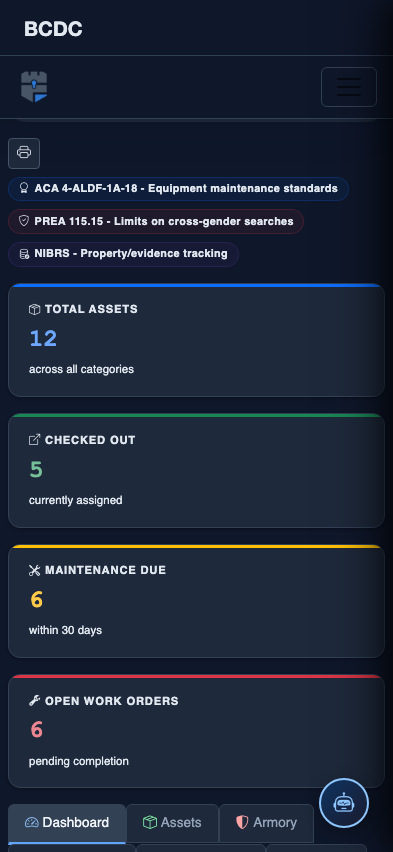
Scrolled / detail view