Intelligence — Jail Analytics & Insights
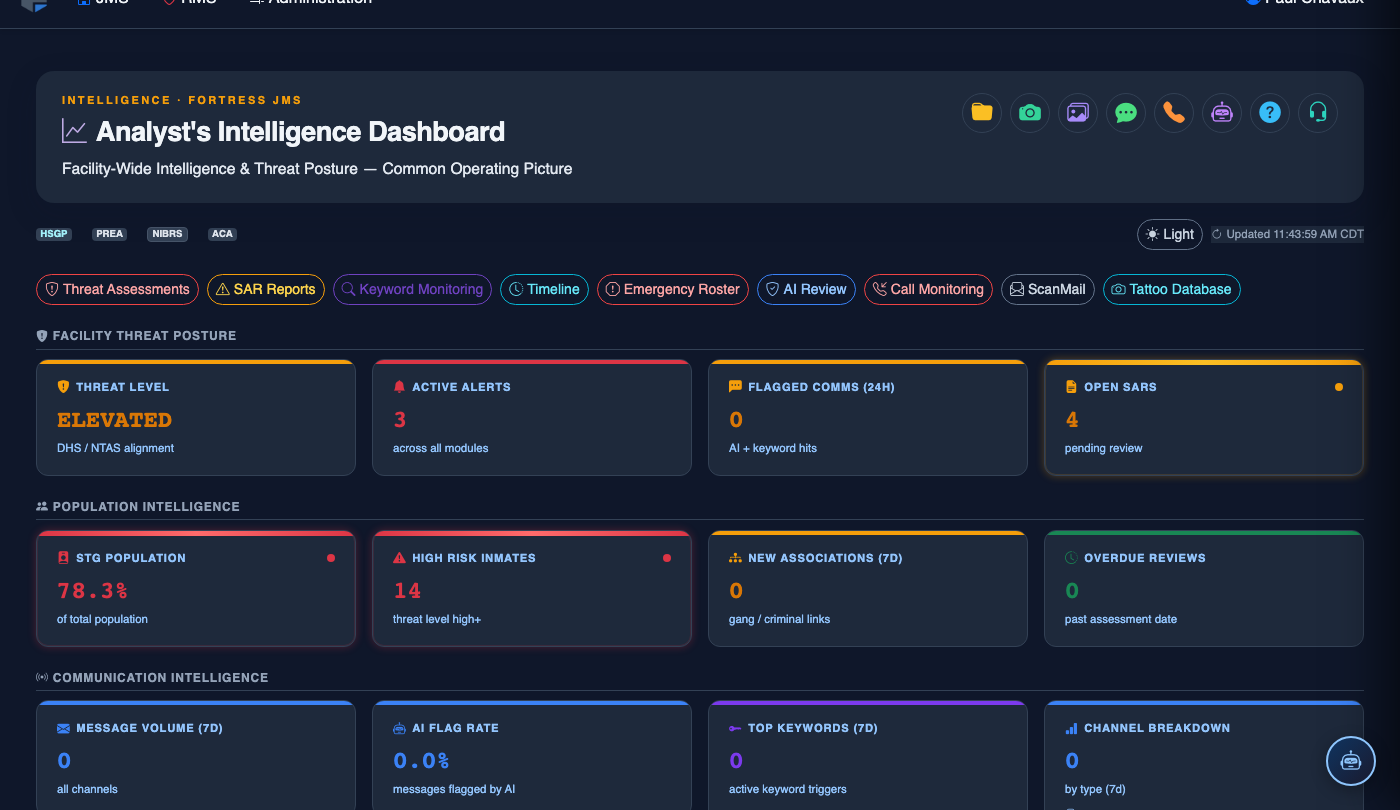
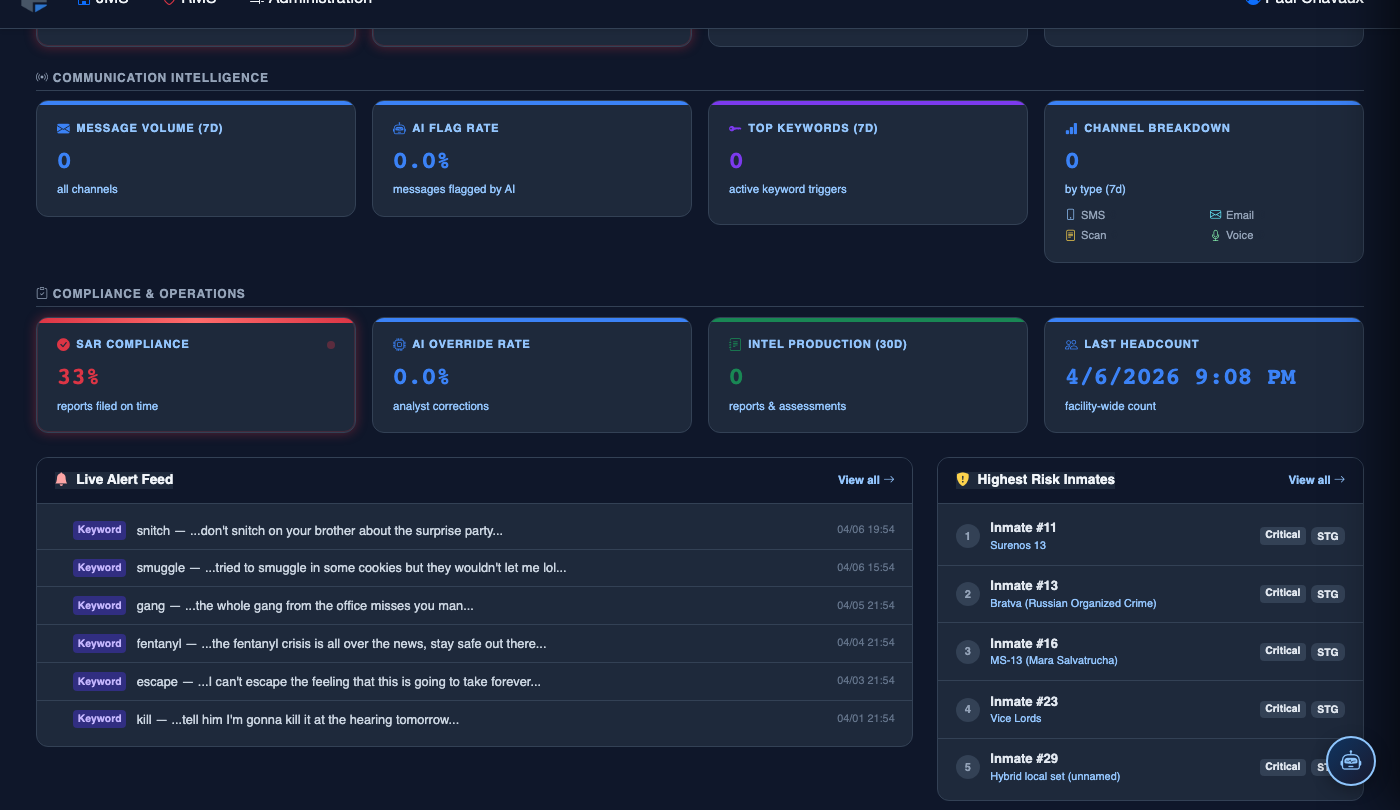
The FortressDMS Intelligence module transforms your facility’s operational data into actionable insights. Interactive dashboards surface population trends, classification distributions, disciplinary patterns, and staffing metrics in real time — giving administrators and command staff the situational awareness needed to make faster, better-informed decisions. Move beyond static monthly reports and give your leadership team a live operational picture of the entire facility.
Population Analytics
Track daily population counts, ADP trends, release projections, and bed utilization rates across all housing units.
Classification Breakdown
Visualize the distribution of inmates by risk level, charge category, and special management designation at a glance.
Incident Trend Analysis
Spot rising disciplinary incident rates by unit, shift, or officer and intervene before conditions escalate.
Staffing & Coverage Metrics
Monitor post coverage ratios, overtime accumulation, and shift vacancy rates to support budget and scheduling decisions.
Custom Report Builder
Drag-and-drop fields from any FortressDMS data domain into a custom tabular or chart report, then schedule it for automatic delivery.
Threshold Alerts
Configure alert thresholds so command staff receive instant notifications when a KPI exceeds a defined limit.
Step-by-Step: Using Intelligence Dashboards
Access the Intelligence Module
Click Intelligence in the main navigation. The landing page presents the Executive Dashboard — a high-level summary of today’s population count, active incidents, bed availability percentage, and pending court transports.
Select a Dashboard or Report
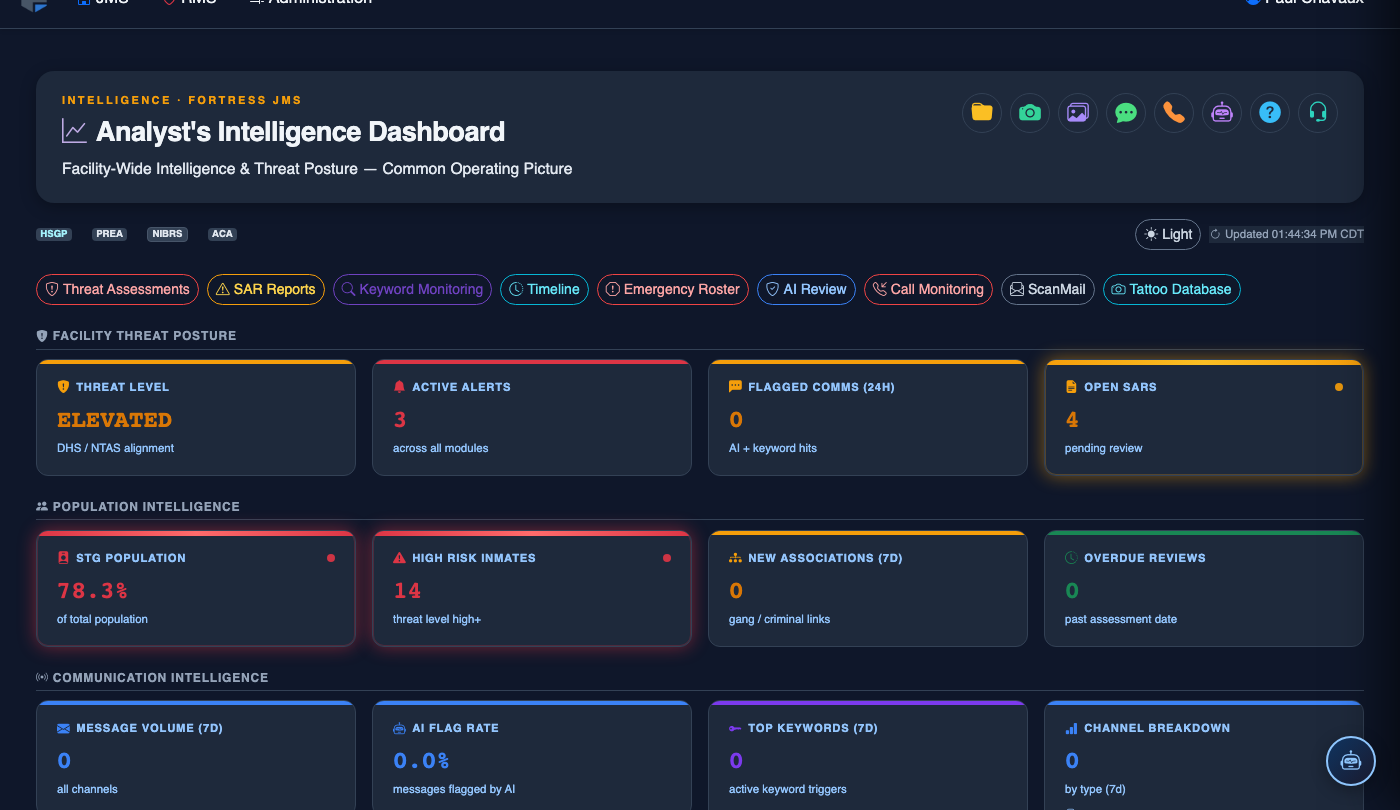
Use the left panel to navigate between pre-built dashboards: Population Trends, Classification Summary, Disciplinary Incidents, Medical Encounters, and Staffing Overview. Each dashboard refreshes every 15 minutes from live facility data.
Filter by Date Range and Housing Unit
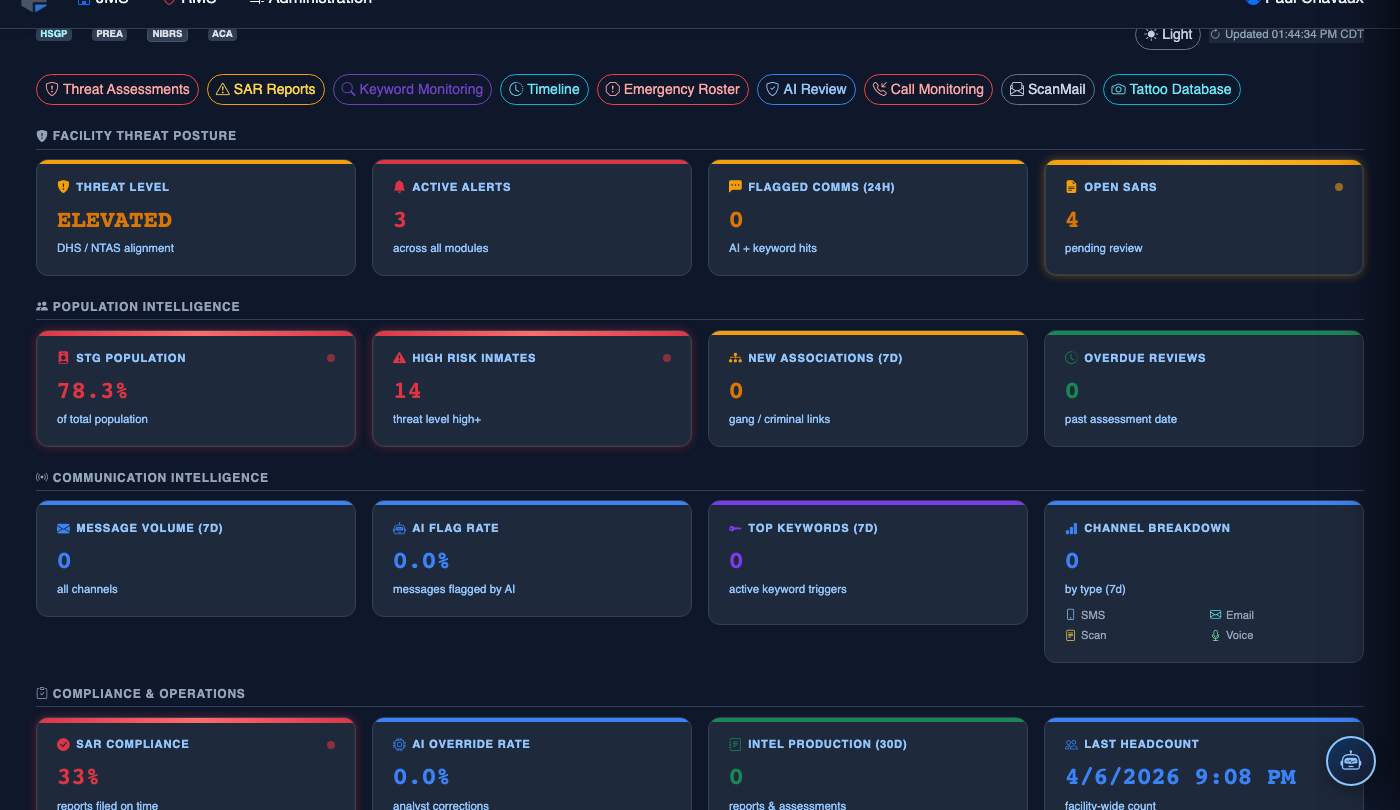
At the top of any dashboard, use the Date Range Picker and the Unit Filter dropdown to narrow data to a specific block, pod, or facility-wide view. The charts update instantly — no page reload required.
Drill Into Chart Data
Click any bar, segment, or data point on a chart to open a Detail Panel listing the individual records behind that metric. From the detail panel, you can navigate directly to the underlying inmate record, incident report, or shift log with one click.
Build a Custom Report
Go to Custom Reports and click New Report. Choose a Data Domain (Bookings, Incidents, Medical, Commissary, etc.), drag fields into the column builder, set grouping and sort options, then click Preview to see a live sample before saving.
Schedule Automated Report Delivery
After saving a report, click Schedule Delivery. Choose a frequency (Daily, Weekly, Monthly), select recipients from your staff directory, and pick the output format (PDF or Excel). Reports are emailed automatically at the configured time.
Configure Threshold Alerts
Navigate to Alert Rules and click + New Alert. Select a metric (e.g., Daily Incident Count), set the threshold value, choose notification channels (email, SMS, in-app), and assign the recipient role. When the metric crosses the threshold, command staff are notified in real time.
💡 Pro Tips
- Pin your most-used dashboards to Favorites using the star icon — they will appear at the top of the Intelligence panel each time you log in.
- Use the Compare Periods toggle on the Population Trends dashboard to overlay the current month against the same period last year for budget justification reports.
- Export the Classification Summary chart directly into a PowerPoint-ready image using the Export PNG button — ideal for county commission presentations.
- Combine the Incident Trend and Staffing Overview dashboards side-by-side to identify whether incident spikes correlate with specific shifts or staffing shortages.