System Health Monitoring
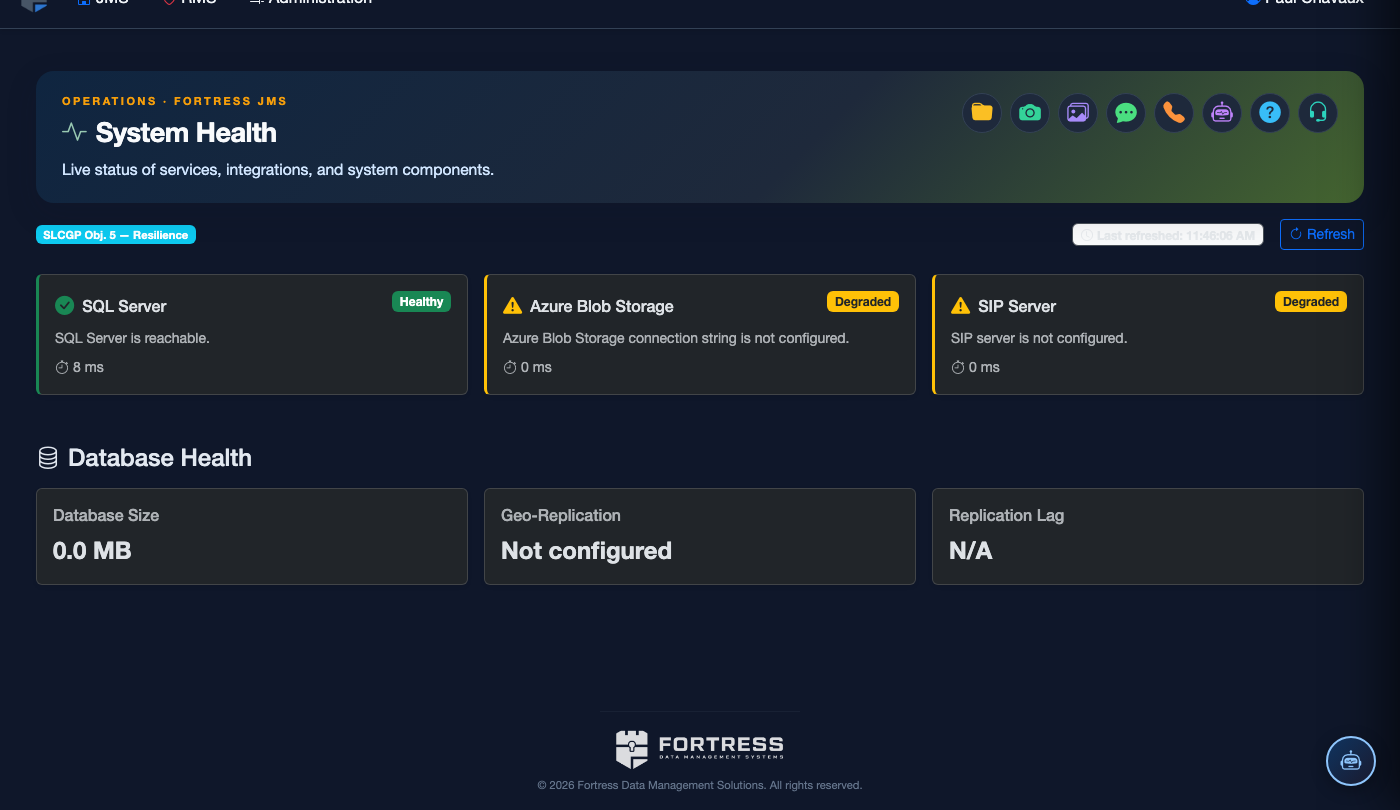
System Health gives facility technology administrators a real-time dashboard of every service, integration, and infrastructure component powering FortressDMS. Monitor API response times, database connectivity, background job queues, and third-party integrations — such as commissary vendors and court scheduling feeds — from a single pane of glass. Proactively identify degraded services before they impact booking, classification, or inmate communication operations.
Live Service Status
Color-coded status indicators (green/yellow/red) show the real-time health of every JMS service at a glance — no command-line access required.
Performance Metrics
Track API response latency, database query times, and active user session counts with historical trend charts for capacity planning.
Threshold Alerts
Configure alert thresholds so IT staff are notified by email or SMS when any metric exceeds acceptable limits before it becomes an outage.
Integration Health
Monitor the live status of external integrations — court scheduling feeds, commissary vendor APIs, and biometric systems — with last-sync timestamps.
Step-by-Step: Monitoring System Health
Access the System Health Dashboard
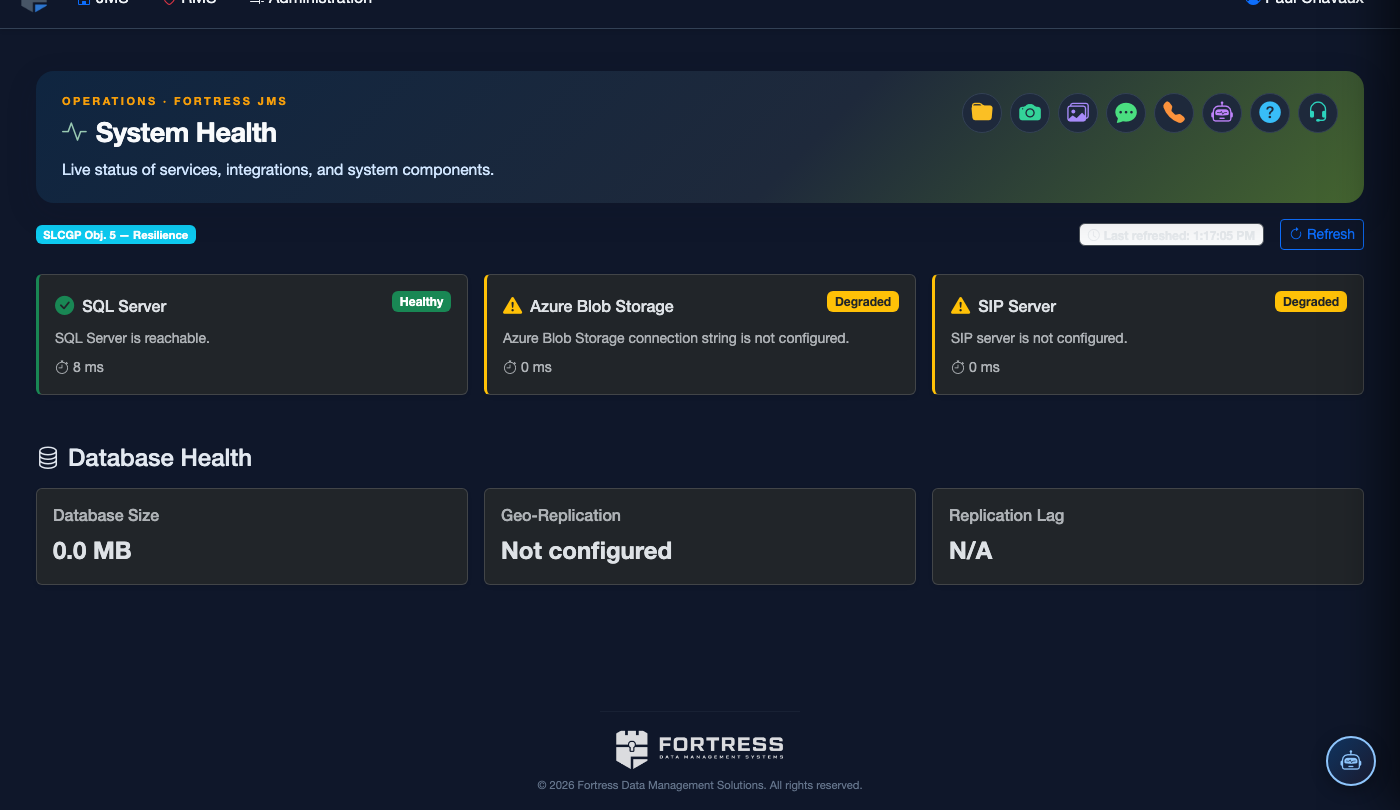
Navigate to Administration > System Health. The dashboard auto-refreshes every 60 seconds and is accessible only to users with the System Administrator role. The top summary bar shows overall system status: Healthy, Degraded, or Critical.
Review Individual Service Cards
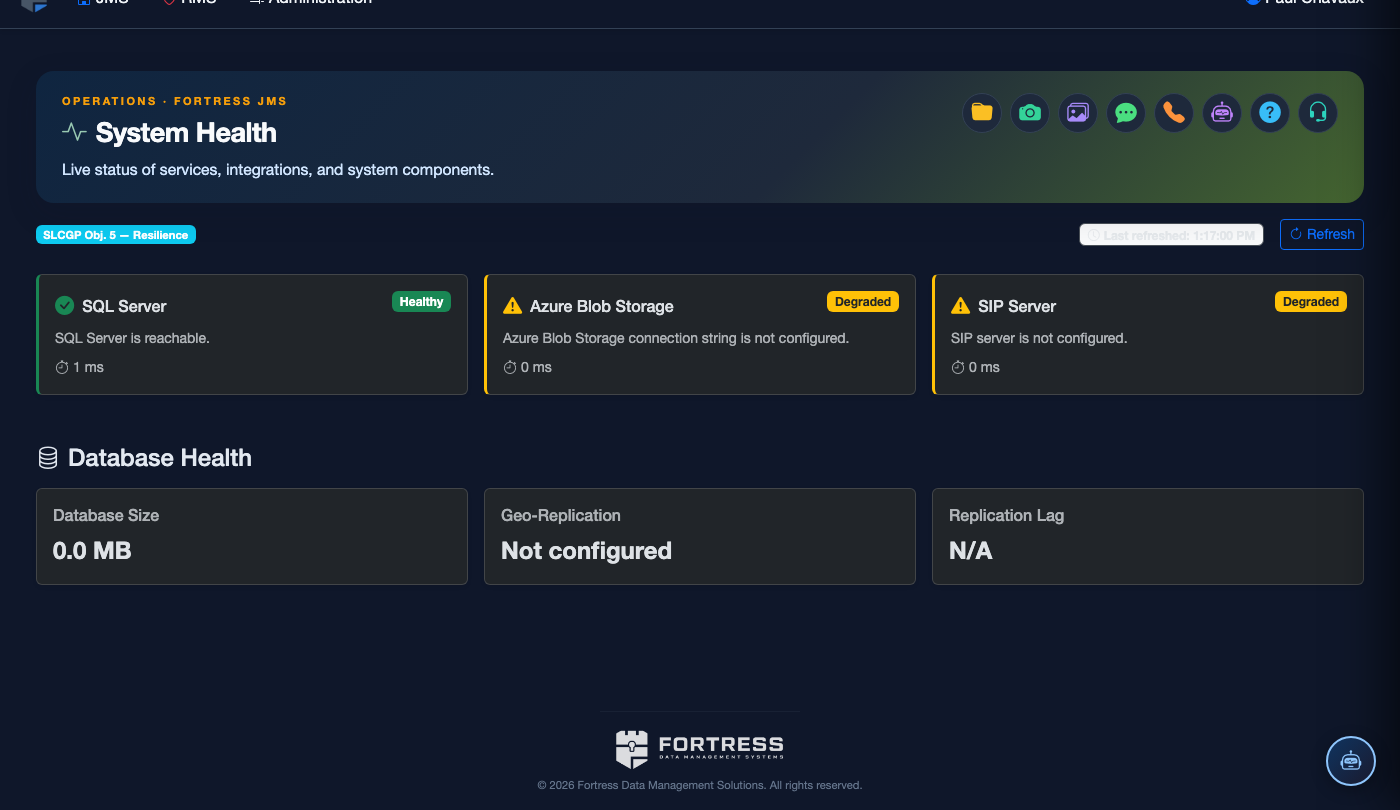
Each service — Database, API Gateway, Background Job Queue, Email Service, Commissary Integration, Court Feed — is shown as a card with its current latency in milliseconds, last-checked timestamp, and uptime percentage over the past 24 hours. Yellow indicates elevated response times; red indicates a failure.
Drill Into Service History
Click any service card to open its Detail Panel. The panel displays a 7-day performance chart, a log of recent status changes with root-cause notes, and the last 10 error messages if the service has failed. Use this view to distinguish transient network blips from persistent degradation requiring vendor escalation.
Configure Alert Thresholds
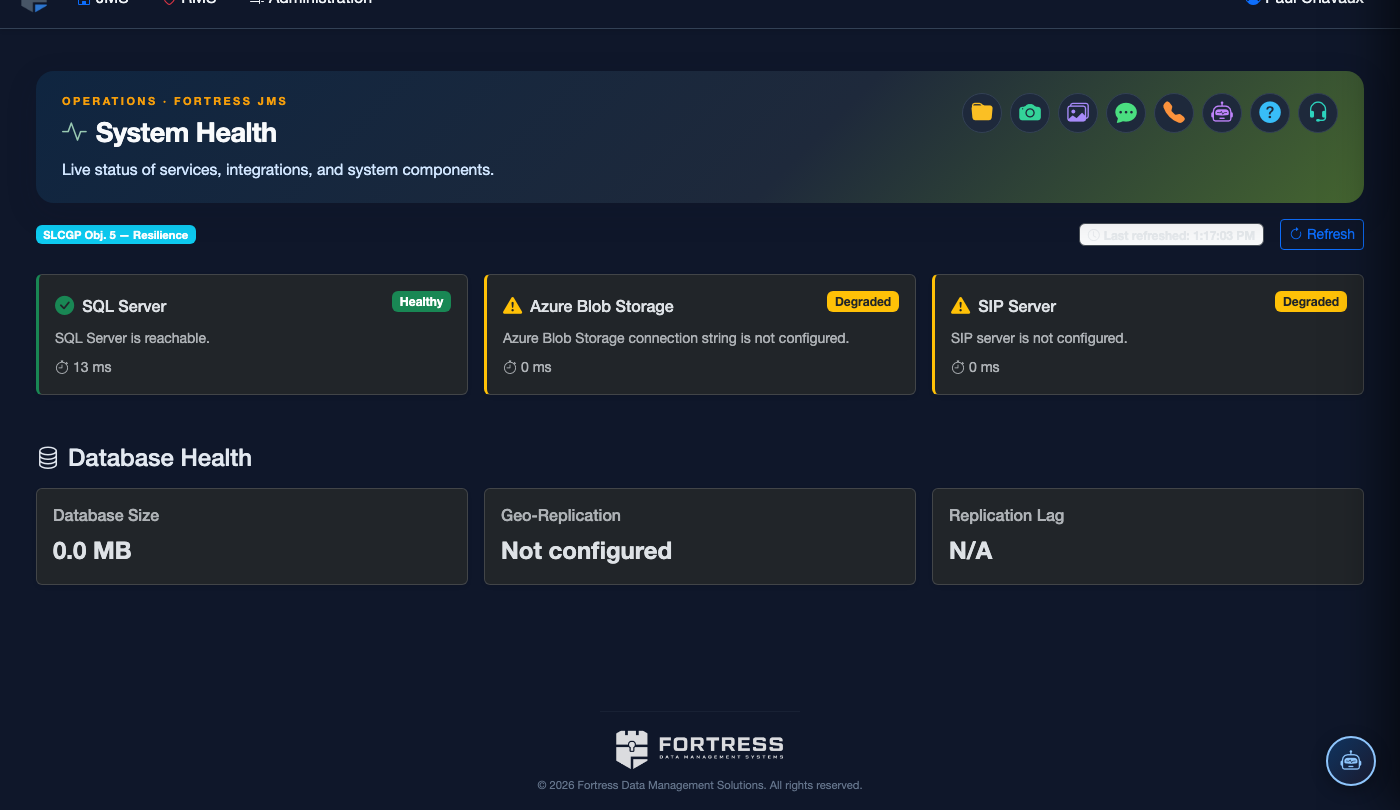
Click Alert Settings at the top of the dashboard. For each service, set a Warning Threshold (ms) and a Critical Threshold (ms). Enter one or more administrator email addresses and optional SMS numbers. Click Save Alert Configuration. Alerts fire within 2 minutes of a threshold breach and automatically resolve when the service recovers.
Respond to a Degraded Service
When a card turns yellow or red, click View Details to read the error log. If the issue is an external integration (e.g., commissary vendor API timeout), use the Contact Vendor link prepopulated with the vendor’s support contact. For internal services, click Restart Service (available to System Administrators) to attempt an automated recovery without a full system restart.
Review Background Job Queue
The Job Queue section lists all pending background tasks — scheduled report generation, data sync jobs, and notification delivery. Jobs stuck in Processing for more than 15 minutes may indicate a hung worker. Use the Cancel Job action to remove stuck items and allow the queue to resume normal processing.
Generate a System Health Report
Click Export Health Report to generate a PDF summary of uptime statistics, alert history, and integration sync logs for the selected date range. This report is suitable for presenting system reliability metrics to county commissioners or IT oversight committees during budget and contract review cycles.
💡 Pro Tips
- Bookmark the System Health dashboard and include it in your shift-change briefing routine — a 30-second glance at the status cards each shift handover prevents small issues from becoming operational emergencies mid-shift.
- Set your Database service warning threshold conservatively (e.g., 200 ms) — booking and classification modules become noticeably sluggish at sustained latencies above 500 ms, and early warning gives you time to act before staff report issues.
- If a third-party commissary or court integration shows repeated sync failures, document the timestamps from the Health dashboard before contacting the vendor — having precise error windows dramatically shortens resolution time on vendor support calls.