
Movement Analytics
The Movement Analytics tab transforms raw transport and movement data into actionable operational intelligence for jail administrators and command staff. Interactive charts and configurable dashboards surface trends in transport volume, destination frequency, escort staffing efficiency, mileage costs, and on-time performance — enabling data-driven decisions about fleet sizing, staffing allocation, and budget planning. All analytics are exportable for monthly reports, grant applications, and legislative briefings.
Transport Volume Trends
Line and bar charts showing transport volume by day, week, and month help identify peak periods and seasonal patterns for staffing and fleet planning.
Destination Heatmap
Visual frequency map of transport destinations reveals which courts, hospitals, and facilities generate the most officer trips, informing routing optimization.
On-Time Performance
Track scheduled vs. actual departure and arrival times across all transports, and drill into late departures to identify systemic bottlenecks.
Cost Analysis
Per-trip cost breakdowns combining officer overtime, vehicle mileage, and maintenance costs provide accurate figures for budget submissions and cost-sharing agreements.
Step-by-Step: Building a Movement Analytics Report
Open Movement Analytics
Go to Inmate Movement > Movement Analytics. The default view loads the Executive Dashboard showing current-month KPIs: total transports, total transport miles, average trip duration, and on-time percentage. Each KPI tile shows the change versus the prior period. Click any tile to drill into the underlying detail view.
Set the Date Range and Filters
Use the Date Range picker at the top to select a custom period, or choose a preset like Last 30 Days, This Quarter, or Year to Date. Apply optional filters for Transport Type, Destination, Vehicle, or Officer to focus the analysis on a specific segment of movement activity.
Explore the Volume Trend Chart
Click the Volume Trends chart tab. Toggle between Daily, Weekly, and Monthly granularity. Hover over any data point to see the exact transport count for that period. Use the Compare Period toggle to overlay the prior year’s data on the same chart to identify growth or seasonal patterns.
Review Destination and Cost Breakdowns
Click the Destinations tab to see a ranked table of all transport destinations sorted by frequency and total cost. The Cost per Trip column combines mileage and officer time costs. Click any destination row to see the full transport history for that location, including on-time rate and incident count.
Analyze Officer and Vehicle Utilization
Switch to the Resources tab to view officer and vehicle utilization rates. The Officer Transport Hours bar chart shows which officers are carrying the most transport duty, allowing supervisors to balance workload equitably. The Vehicle Utilization chart ranks vehicles by trip count and total miles to support replacement planning decisions.
Save a Custom Dashboard
Arrange the charts and filters to match your reporting needs, then click Save Dashboard and give it a name such as “Monthly Admin Report.” Saved dashboards appear in the sidebar and can be shared with specific staff roles. A saved dashboard re-opens with the same layout and applies the current month’s data automatically.
Export and Schedule Reports
Click Export to download the current dashboard view as a PDF or the underlying data as CSV. To automate recurring reports, click Schedule Report, select the frequency (weekly, monthly), and enter the recipient email addresses. The report will be generated and emailed automatically on the configured schedule.
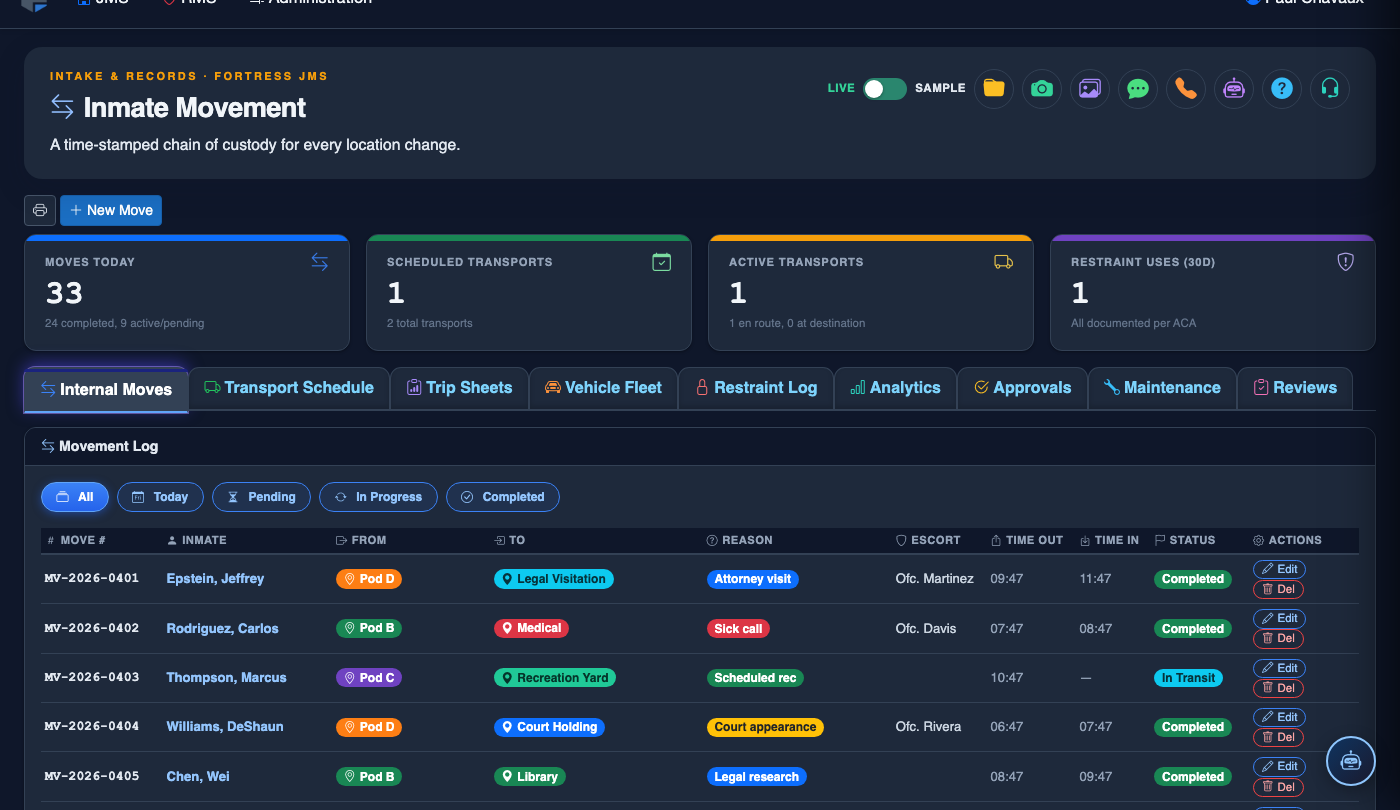
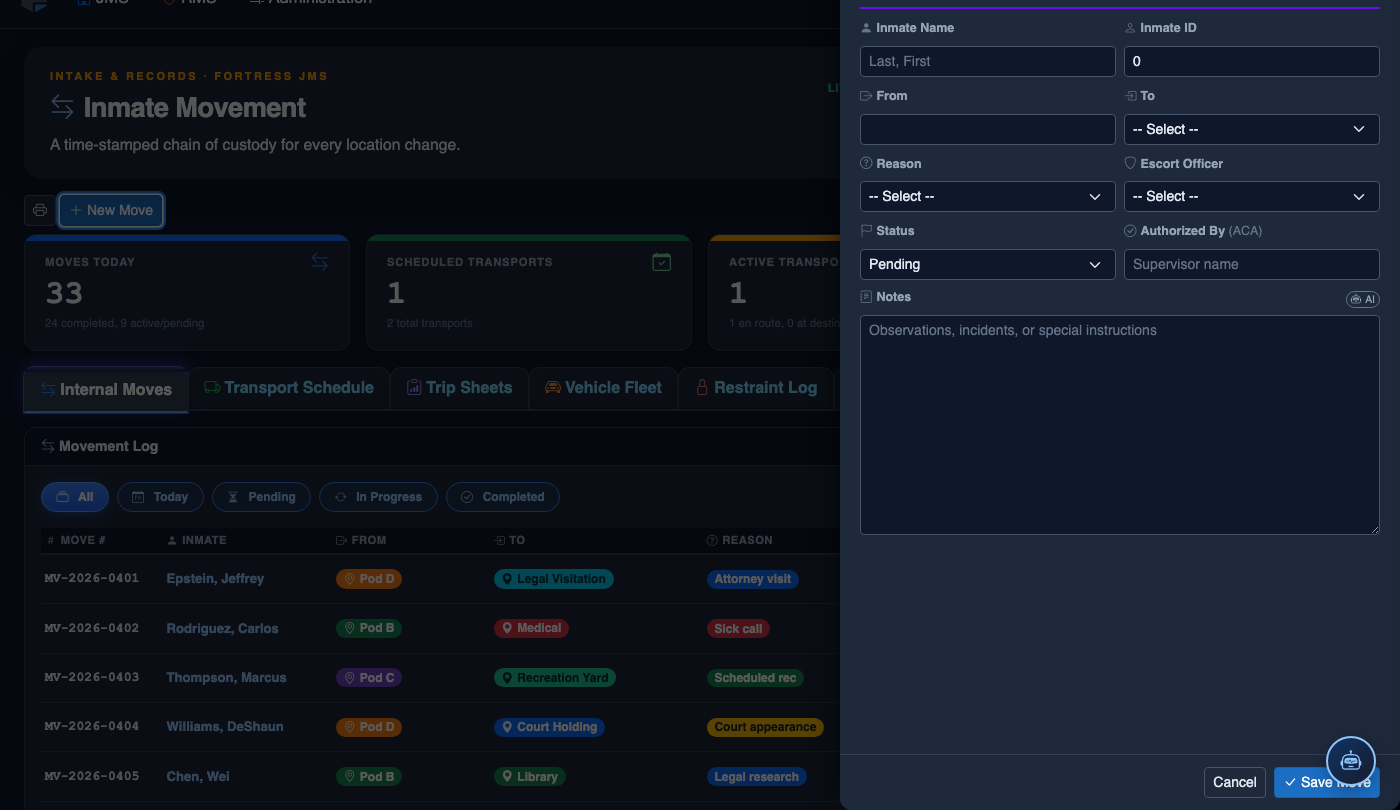
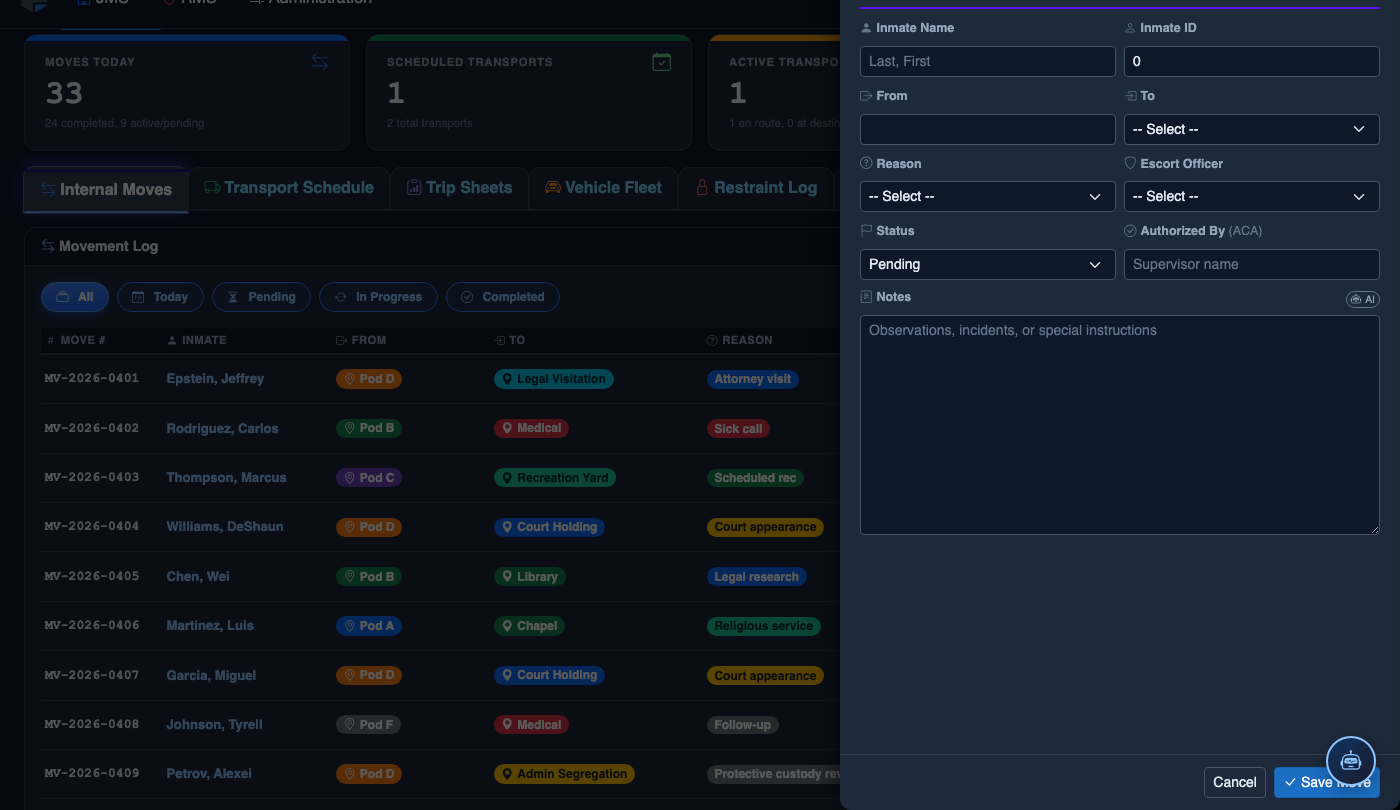
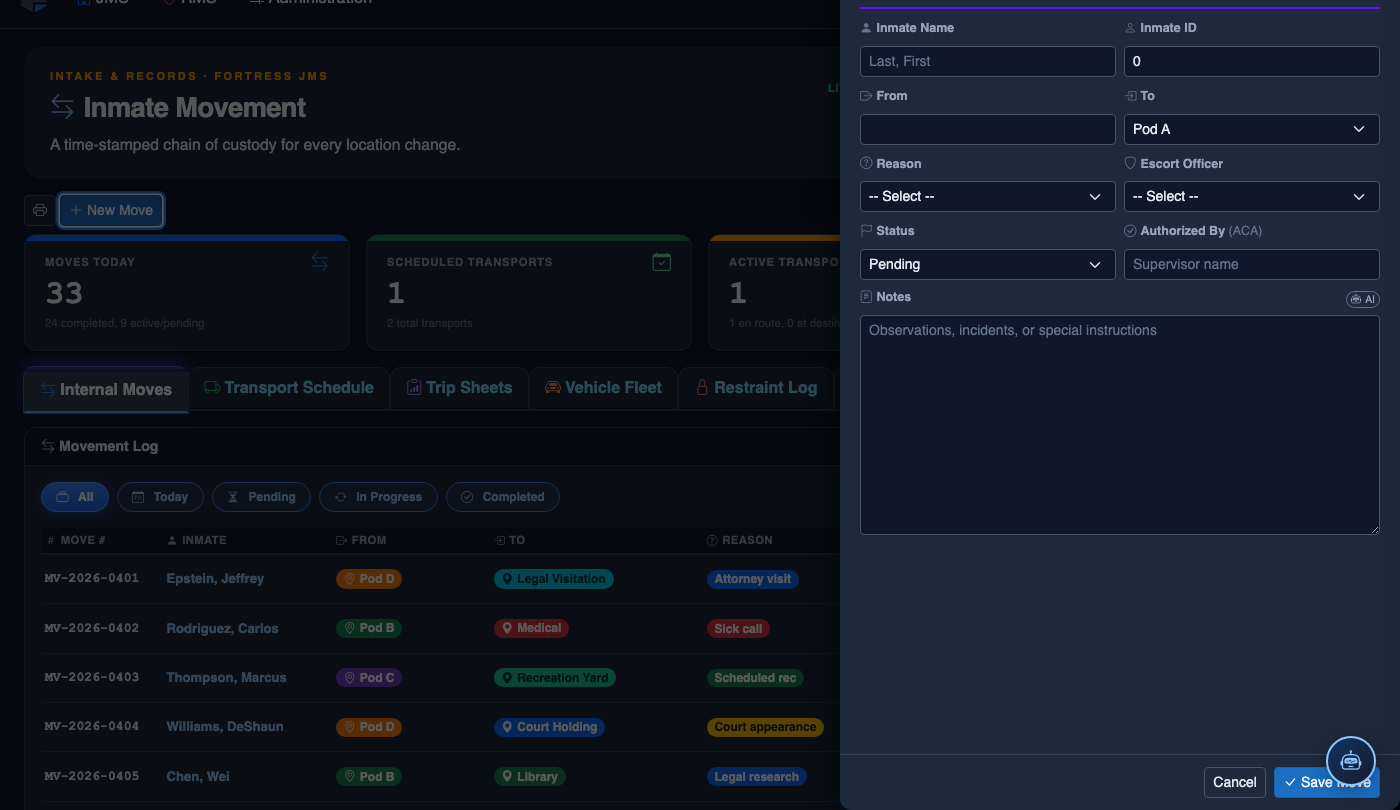
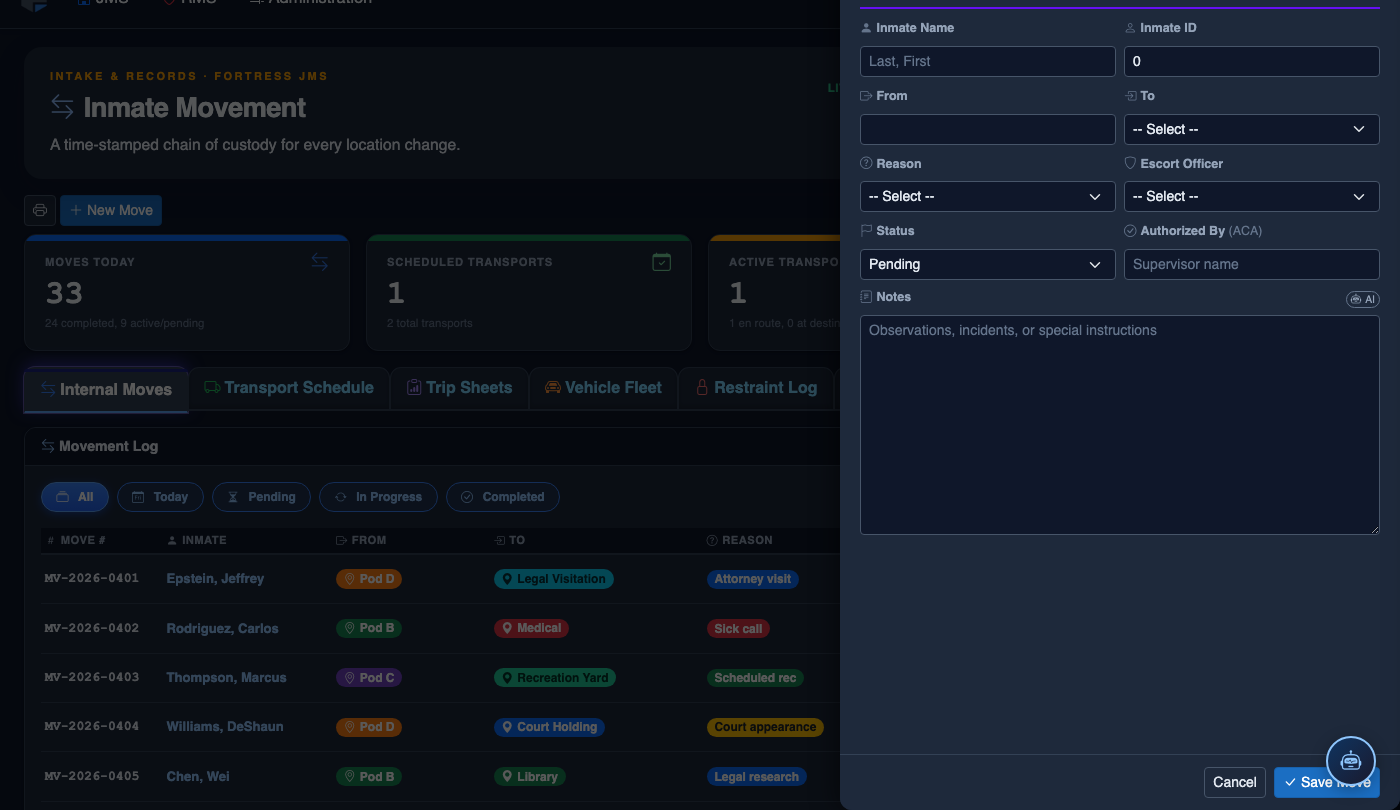
Log a New Movement
Click New Move in the module toolbar. Complete the movement record:
- Inmate — search by name or booking number.
- From Location — select origin unit, pod, and cell.
- To Location — select destination; the system flags restricted or unavailable beds.
- Movement Type — Internal Transfer, Court Transport, Medical, or Emergency.
- Reason — Classification Change, Disciplinary, Safety, Court Hold, etc.
- Authorizing Officer and Escorting Officer.
- Scheduled Date/Time — defaults to now for immediate moves.
- Click Save Movement. Bed Roster and Assignment records update automatically.
💡 Pro Tips
- Pin your most-used analytics dashboard to the Inmate Movement module homepage using the star icon — it loads instantly each time you enter the module.
- Use the Year-over-Year Volume Comparison when preparing budget requests — it provides defensible data for staffing and fleet acquisition proposals to county commissioners.
- If on-time performance dips below your facility’s target, filter by Departure Location to identify if a specific booking area or housing unit is consistently causing delays before transport.
Mobile View — Movement Analytics
FortressDMS is fully responsive. Officers can access the Movement Analytics on a phone or tablet directly from the field — no app install required.
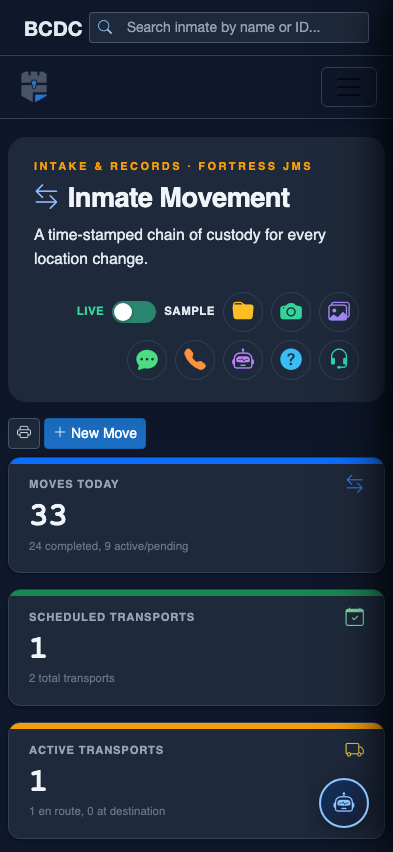
Tab view with data rows
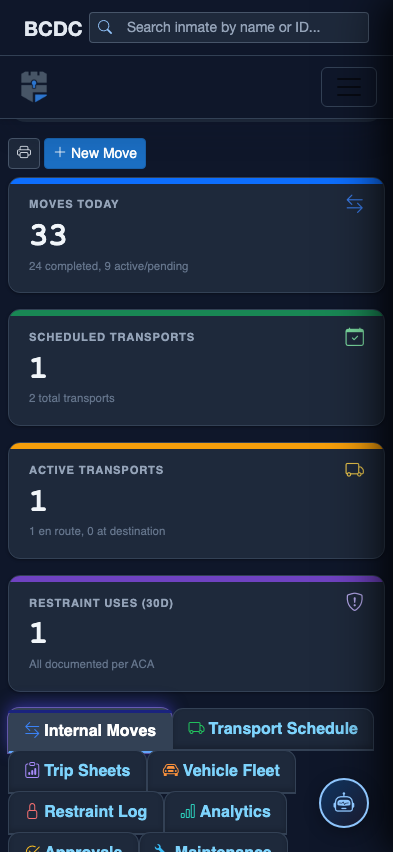
Scrolled / detail view